What Is Spillage?
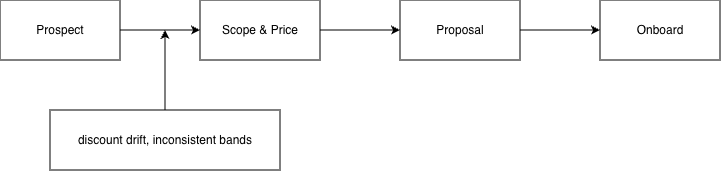
Spillage is revenue that never makes it to billing because it leaks at the very start of the revenue lifecycle, during scoping, pricing, proposal, and onboarding. It’s the value lost when teams default to conservative pricing, offer avoidable discounts, or lack the data and confidence to price to the value delivered. It is not an invoicing or collections issue; that would be post‑booking leakage.
Spillage matters because it quietly thins margins, distorts forecasts, and suppresses enterprise value—before Finance ever sees a dollar. This Topics page complements the deeper PureFacts whitepaper; for background, see Further reading (internal link, slug to validate).
With a unified Book of Record inside the PureRevenue platform, advisors and leaders see credible fee, compensation, and performance data side‑by‑side. That visibility boosts pricing confidence and reduces fear‑based discounting.
Why Spillage Matters Now
- Fee pressure is structural. U.S. mutual fund/ETF fees fell to an asset‑weighted average of ~0.34% in 2024, reinforcing investor price sensitivity that bleeds into advice pricing (Morningstar, May 2025).
- Revenue growth is market‑dependent. Roughly 70% of 2024 revenue growth for asset managers came from market performance, not flows, making the top line fragile and forecasts volatile (BCG, Apr 2025).
- Profitability remains tight. North American industry profits declined ~5% in 2023 despite AUM recovery (McKinsey, Sep 2024).
- Pricing is a high‑leverage lever. A 1% price improvement can lift profit by ~6% for a typical large company (McKinsey, May 2024).
- Board‑level scrutiny is rising. Outlooks project ongoing margin pressure and demand for tech‑enabled revenue discipline through 2025 (Deloitte, Jan 2025). Additional reading: ETF.com, Jun 2025.
How to Spot Spillage Early (Signals & Quick Checks)
- Discount drift: proposals cluster at the bottom of fee ranges without clear rationale.
- Proposal variability: similar client profiles get different pricing and terms.
- Exception sprawl: manual approvals and “specials” outnumber in‑policy deals.
- AUM‑to‑revenue yield gaps: new relationships price below your policy yield.
- Household recognition misses: related accounts not linked at onboarding.
- Contract language mismatch: client‑facing language differs from governing fee documents—raising operational and regulatory risk (see HLS Forum, Dec 2024 and Eye on Enforcement, Jun 2025).
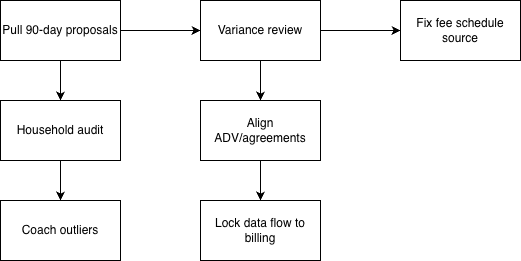
Spillage Triage Checklist (≤30 days)
- Sample 50 recent proposals by segment; compare policy yield vs. offered; flag >5 bps variance without documented rationale.
- Review last quarter’s exception log; categorize by trigger (competitive, householding, legacy promise, asset class).
- Reconcile fee schedule versions across CRM, proposal tool, and onboarding packets; lock a single master.
- Household audit: match related parties via SSN/EIN/address/email; link before first bill.
- Policy language pass: align Form ADV, advisory agreements, and proposal templates on valuation basis, billable assets, and breakpoints (see HLS Forum, Dec 2024; Eye on Enforcement, Jun 2025).
- Advisor pattern scan: rank advisors by average discount from policy yield; coach top outliers with deal reviews.
- Data trail check: ensure proposal outputs flow unchanged into onboarding and billing—no spreadsheets as intermediaries.
Core Levers to Reduce Spillage (High-Level)
Pricing Architecture & Discipline
What it is: Clear fee bands, approval thresholds, and required business justifications embedded in tools.
How it reduces spillage: Shrinks discretionary discounting and removes inconsistent pricing for similar clients.
Example: Require a short “value memo” for any proposal >5 bps below policy yield; manager approval unlocks the PDF.
Revenue Mix & Packaging
What it is: Define bundles (e.g., portfolio + planning + tax coordination) and price by scope, not habit.
How it reduces spillage: Moves conversations from fee cuts to scope choices; clarifies what’s included vs. premium.
Example: Offer a planning‑inclusive package at the mid‑band rate, with add‑on pricing for specialized services.

Segmented Monetization
What it is: Differentiate pricing by client segment and complexity, not just AUM tiers.
How it reduces spillage: Aligns fees to effort and outcomes; avoids over‑servicing at under‑pricing.
Example: Create a “professional family” segment with planning cadence and surcharge for bespoke entities.
Advisor Compensation Alignment
What it is: Pay on realized yield vs. policy, not only on gross production.
How it reduces spillage: Incentivizes disciplined pricing and discourages reflexive concessions.
Example: Add a bonus modifier tied to each advisor’s pricing conformance (within‑band close rate and average discount).
Data-Driven Revenue Governance
What it is: A single source of truth for fee policy, proposals, approvals, onboarding, billing, and compensation.
How it reduces spillage: Eliminates version drift and makes pricing decisions traceable and defensible.
Example: Use the PureRevenue platform with a Book of Record so proposal terms flow directly to onboarding and billing with audit trails, dashboards, and exception analytics.

Regulatory focus on fee calculation accuracy and disclosure consistency continues—aligning systems and documents reduces compliance risk: see HLS Forum, Dec 2024.
What Happens If You Ignore Spillage?
- Silent margin erosion: small, recurring under‑pricing compounds and suppresses EBITDA—amid ongoing fee compression (Morningstar, May 2025).
- Advisor flight risk: inconsistent pricing and unclear approvals frustrate top producers.
- Client migration: over one‑third of millennial millionaires considered switching firms within 12 months (Barron’s, Mar 2024; source J.D. Power).
- Compliance exposure: fee‑related enforcement and exam focus persists (HLS Forum, Dec 2024; Eye on Enforcement, Jun 2025).
Who Owns Spillage
CFO: Owns revenue policy and financial integrity; sets yield targets and monitors realized vs. policy rates.
COO: Embeds pricing rules and approvals in workflow—not just in documents.
Head of Revenue/Strategy: Designs segment packages and win‑loss playbooks; chairs the pricing huddle.
Compliance: Confirms disclosures, agreements, and system rules match; reviews exceptions and audits files.
Why PureFacts?
- Diagnostic insights: Analyze fee architecture, pre‑booking spillage indicators, and compensation alignment inside PureRevenue.
- Strategic playbooks: Monetization patterns by client segment to shift conversations from discounts to value.
- Benchmarking engines: Internal and external comparators so advisors price with confidence—not guesswork.
- Automation platforms: Configure pricing, billing, and compensation rules at scale with a trusted Book of Record.
- Governance tooling: Dashboards, audit trails, and oversight that make decisions defensible and growth predictable.
FAQs
What is spillage in wealth & asset management?
Spillage is revenue lost before a client’s first bill—usually during scoping, pricing, proposal, and onboarding. It’s caused by discount drift, inconsistent approvals, and data/contract mis‑matches, not by downstream billing errors (those are leakage). This page complements the deeper whitepaper for background.
How can we estimate “revenue lost before it begins” without a full audit?
Start with a 90‑day sample of proposals and new accounts. Compare policy yield to offered rate by segment, quantify average variance, and model annualized impact. Cross‑check that proposal terms flowed unchanged to onboarding and billing.
Which KPIs reveal pricing spillage vs. billing leakage?
For spillage: average discount from policy yield, within‑band close rate, and exception frequency. For leakage: billing accuracy, reconciliation breaks, and collections aging. Keep them separate so ownership and actions are clear.
How do fee bands and discount approvals work in practice?
Publish fee bands by segment and scope. Require a short “why now” memo for any price outside the band, with tiered approvals. Embed the rules in proposal tools so approvals unlock documents; no approval, no PDF.
How should advisor compensation reinforce pricing discipline without hurting growth?
Tie a portion of variable pay to realized yield vs. policy and to the share of proposals closed within band. Keep room for strategic exceptions, but make consistent, well‑documented pricing the default.
What is a “Book of Record” and why does it matter?
It’s the authoritative trail of pricing decisions, approvals, and effective terms that flows from proposal through onboarding to billing and compensation. A clean Book of Record reduces disputes, improves audits, and ensures what was promised is exactly what’s billed, core to PureRevenue.
How do we run a 60-day pilot to validate spillage reduction?
Pick two segments and five advisors. Lock one fee schedule version, embed approvals, and coach on value memos. Measure close rate, average discount, and exception count against a 90‑day baseline; expand firm‑wide if yield improves.
What governance controls reduce write-downs and concessions?
Synchronize policy language across Form ADV, agreements, and proposals; require justifications for concessions; and review a monthly file sample. See SEC enforcement highlights (Dec 2024) for context.
How can proposal tools and CRMs reduce discretionary discounting?
Use templates with pre‑set fee bands, required rationale fields, and automated household recognition. Route deviations to managers in‑tool; remove spreadsheets so terms flow intact to onboarding and billing.
References
- Boston Consulting Group — Global Asset Management Industry Hit New Record High in 2024 — Apr 2025 — Link
- McKinsey & Company — Beyond the balance sheet: North American asset management 2024 — Sep 2024 — Link
- Morningstar — 2024 US Fund Fee Study — May 2025 — Link
- McKinsey & Company — How to navigate pricing during disinflationary times — May 2024 — Link
- Deloitte Insights — 2025 Investment Management Outlook — Jan 2025 — Link
- J.D. Power — 2024 U.S. Full‑Service Investor Satisfaction Study (press release) — Mar 2024 — Link
- Barron’s — U.S. Bank Takes Lead …; millennial millionaires switching firms — Mar 2024 — Link
- Harvard Law School Forum on Corporate Governance — SEC Private Fund Adviser Enforcement FY 2024 Highlights — Dec 2024 — Link
- ETF.com — Fund Fees at Record Lows (Morningstar) — Jun 2025 — Link
- EY — Global Wealth Management Industry Report — Apr 2024 — Link